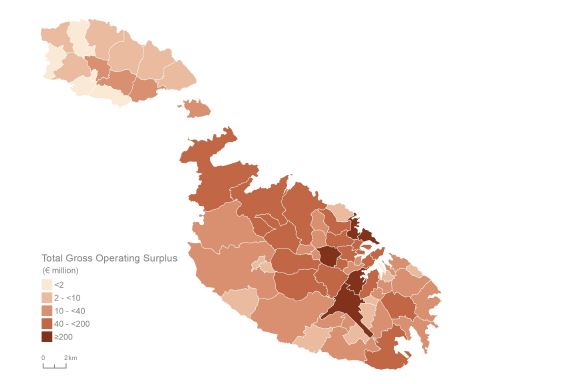
Enterprises with a registered address in Luqa, Marsa, Birkirkara, St Julian’s, and Sliema generated the largest aggregated amounts of profits in the Maltese non-financial economy in 2019, according to a new National Statistics Office (NSO) release.
This could be due to the number of large companies with a national presence that have their offices registered in the industrial and commercial hubs, as their footprint is allocated to the registered address of their respective headquarters.

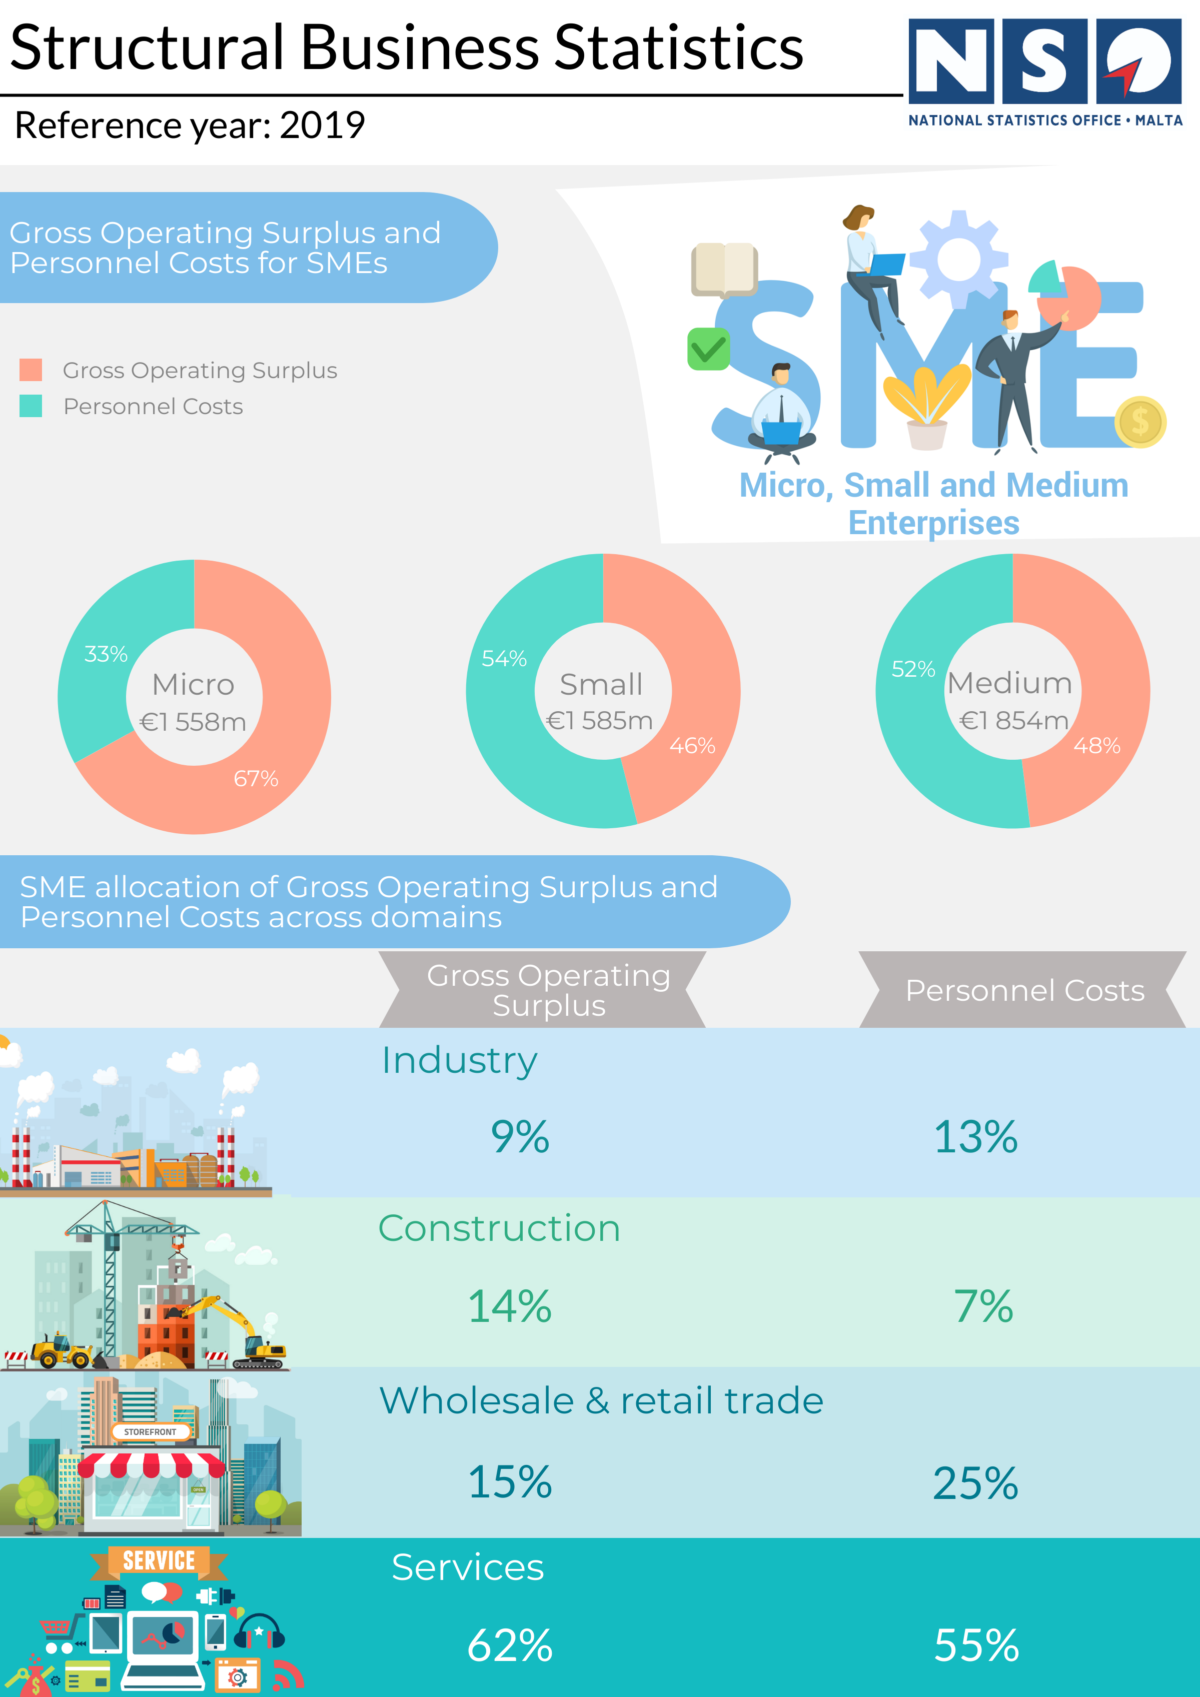
The release also delves into the share of profits and wages recorded by various sizes of companies, and with micro, small and medium enterprises (SMEs) accounting for 69.3 per cent of the combined personnel costs and profits generated by the non-financial business economy in 2019, an increase over their 68.3 per cent share in 2018.

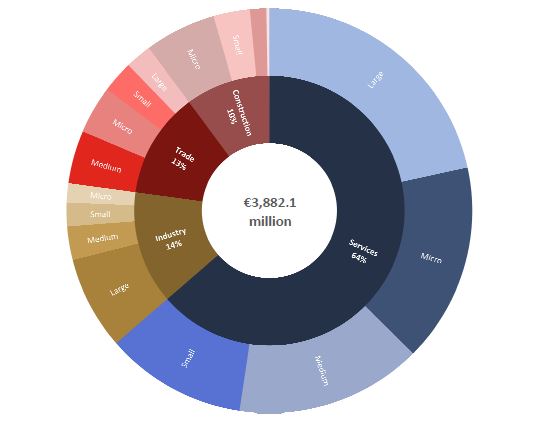
The non-financial business economy in Malta, incorporating industry, construction, wholesale and retail trade, and services activities, was found to have generated €3,882.1 million in gross operating surplus (GOS), or profits, and paid out €3,328.1 million in personnel costs to its employees.
SMEs registered an increase in these two variables of 13 and 10.3 per cent respectively, when compared to 2018.
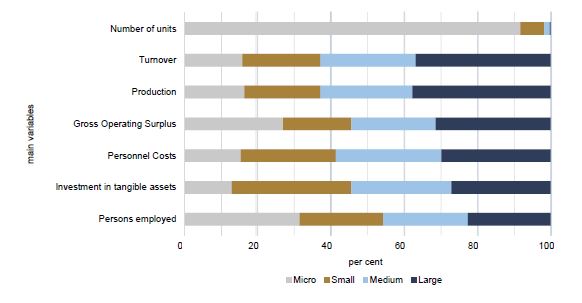
Large enterprises meanwhile earned €1,218.3 million in GOS, and when compared to the other three size categories of SMEs independently, they contributed to the highest values of turnover, production and personnel costs.
There were eight new large enterprises in 2019 when compared to 2018. Turnover and GOS generated by large enterprises increased by 7.7 per cent and 8.3 per cent respectively. Investment in tangible assets for the same category dropped by 27.8 per cent, to €286.8 million.
For the same period, large enterprises registered an increase in the number of persons employed and personnel costs of 4.4 per cent and 4.9 per cent respectively
The largest share (31.4 per cent) of persons employed in Malta were employed with micro enterprises.

On average, personnel costs paid out by large enterprises amounted to €26,465 for each full-time equivalent employee.
For the same criteria, medium enterprises paid out €25,436, while small and micro enterprises paid out €23,940 and €21,076 respectively.
Key indicators across activity domains
During 2019, the largest number of operating enterprises were micro enterprises in the Services (NACE Section H to N, excl. K and Division S95), Wholesale and retail trade (NACE Section G) and Construction (NACE Section F) domains respectively.
Turnover was mostly invoiced by large enterprises in the services domain, leading also to the largest amounts of production and GOS generated in the economy.

Small enterprises in the services domain recorded the largest amount of investment in tangible assets (€259.8 million).
With 27,724 persons employed, micro enterprises in the services domain engaged the largest number of persons, followed by the large and medium enterprises in the same domain at 27,624 and 22,108 persons respectively.

Personnel costs paid by enterprises within the services domain amounted to €1,966.3 million, or 59.1 per cent of the total.
When excluding micro enterprises, due to the element of mixed income, the share of GOS from the combined GOS and personnel costs was higher for larger size classes across all domains.
An exception to this observation was the construction domain, which followed the opposite pattern.
The services domain was dominant in all the main variables of the non-financial business economy.
SMEs were responsible for the largest share of GOS and personnel costs in all the domains except for the industry domain, where large enterprises contributed to the largest share.
Limited liability companies (Ltd and PLC) generated 81.8 per cent of the GOS and 84.6 per cent of the personnel costs, for activities forming part of the non-financial business economy.
‘Gozo expansion has always been on the cards’ – Darscover CEO
Joe Ellul Turner discusses how Darscover’s expansion into Gozo will bring data-driven innovation to the island’s property market
Women now make up 61% of full-time University of Malta students
Women have been consistently outnumbering men in full-time tertiary education
Digital security firm ESET recognised as a ‘Notable Provider’ in Forrester’s European MDR Report
Territory Sales Manager Costas Georgiades highlights the company’s blend of regional expertise, rapid response, and intelligence-driven cybersecurity services


