
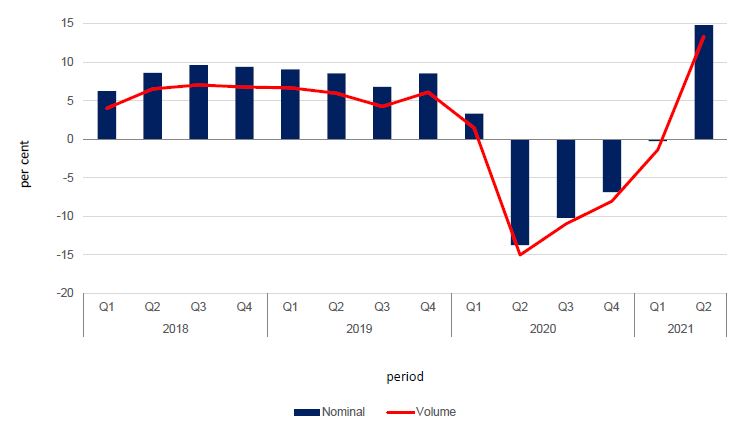
Malta’s Gross Domestic Product (GDP) for the second quarter of 2021 amounted to €3,475.3 million, registering an increase of €448.6 million, or 14.8 per cent year-on-year (YOY) growth rate when compared to the same quarter of 2020, largely driven by service activities like retail, entertainment, financial services and ICT.
However, according to a release on GDP from the National Statistics Office, the biggest driver of GDP growth for Q2 2021 was the accommodation and food service sector, which registered a 165.4 per cent increase over the levels seen in the corresponding period of the previous year.
The second quarter of 2020 coincided with the height of restrictive measures related to the COVID-19 pandemic, with Malta’s borders closed for much of the quarter.
This had an outsized impact on the local hospitality and catering industries, which are dependent on tourism. Similarly, sectors like retail and entertainment we hit hard by the semi-lockdown in the country starting in mid-March 2020, with restrictions only slowly lifted from May.
In volume terms, Malta’s GDP rose by 13.4 per cent between March and June of this year, following the drop of 15 per cent registered a year earlier as a result of the pandemic.
GDP is calculated using three methods:
The production approach
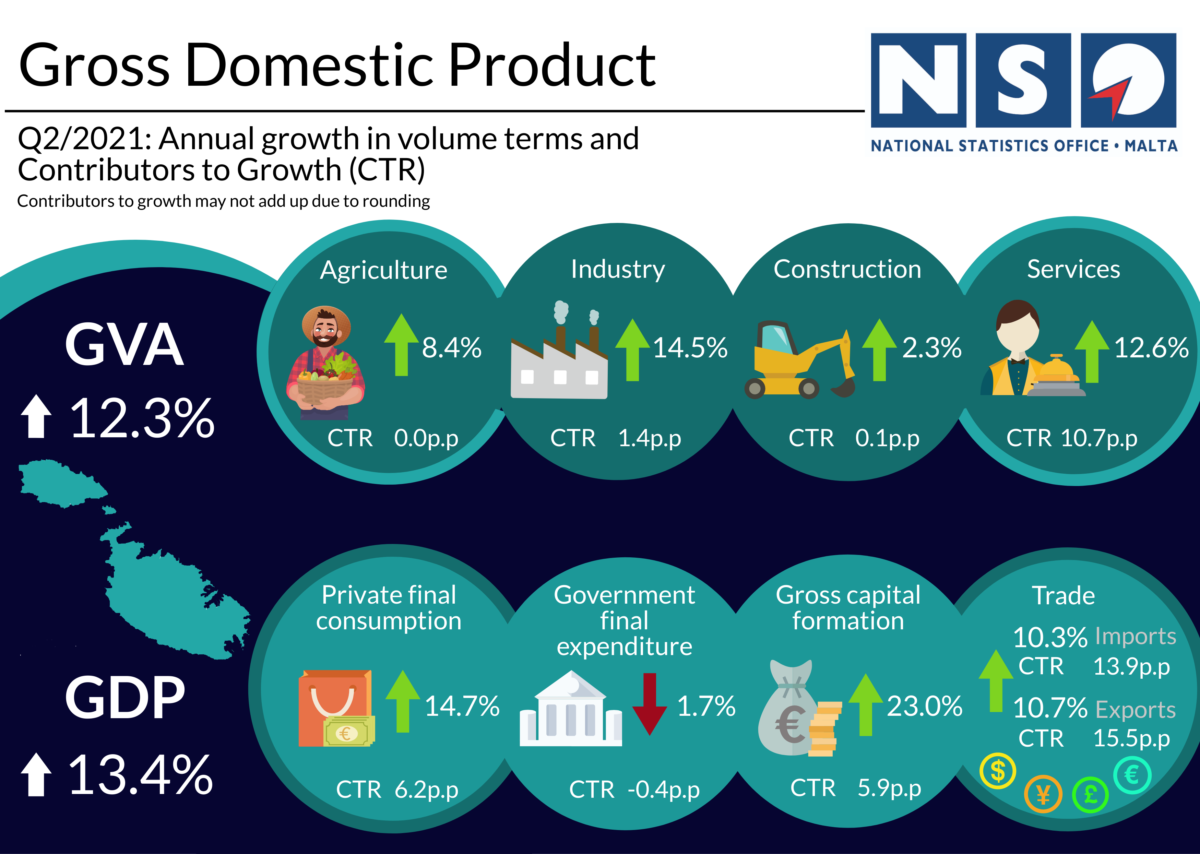
During the second quarter of 2021, Gross Value Added (GVA) rose by 13.8 per cent in nominal terms and 12.3 per cent in volume terms, when compared to same quarter of 2020.
The main drivers behind this 12.3 per cent growth were service activities, industry, and construction, with a contribution of 10.7 percentage points, 1.4 percentage points and 0.1 percentage points, respectively. Agriculture and fishing had a neutral impact on GVA growth.
All these sectors registered an increase in GVA.
A 12.6 per cent increase was recorded in service activities, 14.5 per cent in industry, 2.3 per cent in construction and 8.4 per cent in agriculture and fishing activities.
The increase in services was mainly driven by the following sectors: wholesale and retail trade, repair of motor vehicles and motorcycles (21.2 per cent); arts, entertainment, and recreation activities (17.2 per cent); financial and insurance activities (11.6 per cent); information and communication activities (9.8 per cent); and accommodation and food service activities (165.4 per cent).
Net taxes on products contributed positively towards GDP growth with an increase of 23.9 per cent in volume terms.
The expenditure approach
The expenditure approach is another method used to calculate GDP and is derived by adding final consumption expenditure of households, non-profit institutions serving households (NPISH) and general government, gross capital formation (GCF) and net exports.
The contribution of domestic demand to the year-on-year GDP growth rate in volume terms was of 11.8 percentage points, of which 5.8 were due to final consumption expenditure and 5.9 to gross capital formation.
External demand also registered a positive contribution of 1.6 percentage points, with 15.5 percentage points attributable to exports, and 13.9 percentage points explained by imports.
In the second quarter of 2021, total final consumption expenditure witnessed an increase of 8.9 per cent in volume terms. This was the result of an increase both in household expenditure and in NPISH expenditure, with 15.2 per cent and 2.2 per cent respectively.
However, this was offset by a decrease in general government expenditure of 1.7 per cent.
Gross fixed capital formation (GFCF) rose by 23.6 per cent in volume terms. This increase was mainly attributable to investment in transport equipment.
Exports and imports of goods and services in volume terms increased by 10.7 per cent and 10.3 per cent respectively.
The income approach
The third approach to measure economic activity is the income approach, which shows how GDP is distributed among compensation of employees, operating surplus of enterprises and taxes on production and imports net of subsidies.
Compared to the second quarter of 2020, the €448.6 million increase in nominal GDP was the result of a rise in all the sub-components of the income approach, with an increase of €120.7 million in compensation of employees, €227.5 million in gross operating surplus and mixed income, and €100.3 million in net taxation on production and imports.
Gross National Income (GNI)
The GNI differs from the GDP measure in terms of net compensation receipts, net property income receivable and net taxes receivable on production and imports from abroad.
Considering the effects of income and taxation paid and received by residents to and from the rest of the world, GNI at market prices for the second quarter of 2021 was estimated at €3,169.8 million.
Updates to previous years’ GDP figures
National accounts data has been updated with the Structural Business Statistics (SBS) survey results for reference year 2017. The SBS survey is carried out annually and covers the following industries: NACE Sections B to N, except K, and NACE Division S95 (repair of computers and personal and household goods).
A list of NACE code by category can be found here.
The SBS survey is used to update the main components of the production (output) approach such as output and intermediate consumption, compensation of employees in the income approach, and household final consumption expenditure and GFCF in the expenditure approach.
GDP and GNI at current prices for reference year 2017 were revised upwards by 2.1 and 2.3 per cent respectively.
GDP at current prices was revised upwards by €242.9 million in 2017. Under the production approach, the upward revision was more prominent in accommodation and food service activities; professional, scientific and technical activities; information and communication; wholesale and retail trade, repair of motor vehicles and motorcycles; transportation and storage; real estate activities and construction.
A downward revision was mainly reported in administrative and support service activities.
In the expenditure approach, household final consumption expenditure was mainly revised upwards due to a revision in accommodation originating from SBS survey results.
Following the finalisation of the investment matrix of 2017, GFCF was revised upwards by €60.1 million. The investment matrix was updated using SBS 2017 and various other sources which are used to cover all other industries, namely NACE Sections A, K, O, P, Q, R, S.
In the income approach, compensation of employees was revised upwards by €53.3 million, while gross operating surplus and mixed income, which is a derived variable and incorporates revisions in the production approach and compensation of employees, was revised by €189.6 million in 2017.
The incorporation of the 2017 SBS survey results had an impact on the extrapolation of NACE Sections B to N, except K, and NACE Division S95 for reference years 2018 to 2021.
Revisions in reference years 2018 to 2021 were higher due to updates with administrative sources in human health and social work activities and sports activities and amusement and recreation activities.


Planning Authority and Kamra tal-Periti merge awards into single event
MASP and Premju Galizia have been merged into a single event

MTA launches enforcement proceedings over licensed Swieqi apartment block following inspections
The action follows coordinated inspections carried out by the MTA in Swieqi with the Community Police and the Local Council

56 construction sites found working without OHSA permits between February and May
The minister said that all sites were ordered to stop works